Historically application servers like WebLogic, WebSphere, but also GlassFish were known to start up quite slowly. But is this still true today? In this article we take a look at how fast modern versions of GlassFish start. For comparison we also look at an older fork (Payara).
To measure startup times we use a script that monitors standard output until a certain logline is seen. That script is the following one:
#!/bin/bash

# Usage:
# ./time_until.sh "your_command" "expected_output"

command=$1
expected_output=$2

# Check for required arguments
if [ -z "$command" ] || [ -z "$expected_output" ]; then
    echo "Usage: $0 \"<command>\" \"<expected_output>\""
    exit 1
fi

# Start the timer
start_time=$(date +%s%N)

# Start the command in background, redirect stdout/stderr
# `stdbuf -oL` ensures line-buffered output
stdbuf -oL bash -c "$command" 2>&1 | while IFS= read -r line; do
    echo "$line"
    if [[ "$line" == *"$expected_output"* ]]; then
        end_time=$(date +%s%N)
        elapsed_ns=$(( end_time - start_time ))
        elapsed_ms=$(( elapsed_ns / 1000000 ))
        echo "🎯 Output detected after ${elapsed_ms} ms"

        # Find the PID of the background process and kill it
        pkill -P $$ # kill all child processes of this script
        exit 0
    fi
done &
reader_pid=$!

# Wait for the reader to finish (or command to exit)
wait $reader_pid
With this script we can test a run of GlassFish using:
./time_until.sh "./startserv" "JMXStartupService has started JMXConnector"The machine we used for measurements is a MacBook Pro M1 Pro, with 10 cores, 16GB RAM running macOS 15.5 (24F74). The Java version for the Java 21 based test is:
openjdk 21.0.7 2025-04-15 LTS
OpenJDK Runtime Environment Temurin-21.0.7+6 (build 21.0.7+6-LTS)
OpenJDK 64-Bit Server VM Temurin-21.0.7+6 (build 21.0.7+6-LTS, mixed mode, sharing)
The Java version for the Java 24 based test is:
openjdk 24 2025-03-18
OpenJDK Runtime Environment Temurin-24+36 (build 24+36)
OpenJDK 64-Bit Server VM Temurin-24+36 (build 24+36, mixed mode, sharing)
To start measuring we clean booted the system used for testing first, and re-run every test 11 times, removing the first (cold) result.
Running the script against GlassFish 7.0.25 with Java 21 we get:
GF 7.0.25 (Java 21)
🎯 Output detected after 1818 ms
🎯 Output detected after 1846 ms
🎯 Output detected after 1817 ms
🎯 Output detected after 1828 ms
🎯 Output detected after 1841 ms
🎯 Output detected after 1834 ms
🎯 Output detected after 1835 ms
🎯 Output detected after 1837 ms
🎯 Output detected after 1848 ms
🎯 Output detected after 1818 ms
Out of the box GlassFish boots in around 1800ms, a far cry from the many seconds or even minutes people may think it takes.
Next we tried GF 7.0.25 with Java 24 and AOT class loading (JEP 483). The results are a little bit better:
GF 7.0.25 + AOL (Java 24)
🎯 Output detected after 1712 ms
🎯 Output detected after 1719 ms
🎯 Output detected after 1732 ms
🎯 Output detected after 1698 ms
🎯 Output detected after 1698 ms
🎯 Output detected after 1706 ms
🎯 Output detected after 1722 ms
🎯 Output detected after 1693 ms
🎯 Output detected after 1698 ms
🎯 Output detected after 1693 ms
We also tried an older fork or GlassFish called Payara. This started a bit slower:
Payara 6.2025.5 out of the box
🎯 Output detected after 3654 ms
🎯 Output detected after 3577 ms
🎯 Output detected after 3714 ms
🎯 Output detected after 3537 ms
🎯 Output detected after 3628 ms
🎯 Output detected after 3613 ms
🎯 Output detected after 3635 ms
🎯 Output detected after 3638 ms
🎯 Output detected after 3607 ms
🎯 Output detected after 3621 ms
Payara is clearly out of the box much slower in starting than GlassFish. It can be started faster though by disabling its build-in cache and clusterig Hazelcast. This can be done using:
./asadmin start-domain && asadmin set-hazelcast-configuration --enabled=false --dynamic=true && ./asadmin stop-domainThe results are much better then (at the cost of losing functionality, obviously), but it’s still slower than GlassFish:
Payara 6.2025.5 disabled hazelcast
🎯 Output detected after 2588 ms
🎯 Output detected after 2063 ms
🎯 Output detected after 2062 ms
🎯 Output detected after 2005 ms
🎯 Output detected after 2013 ms
🎯 Output detected after 2062 ms
🎯 Output detected after 2037 ms
🎯 Output detected after 2037 ms
🎯 Output detected after 2059 ms
🎯 Output detected after 2030 ms
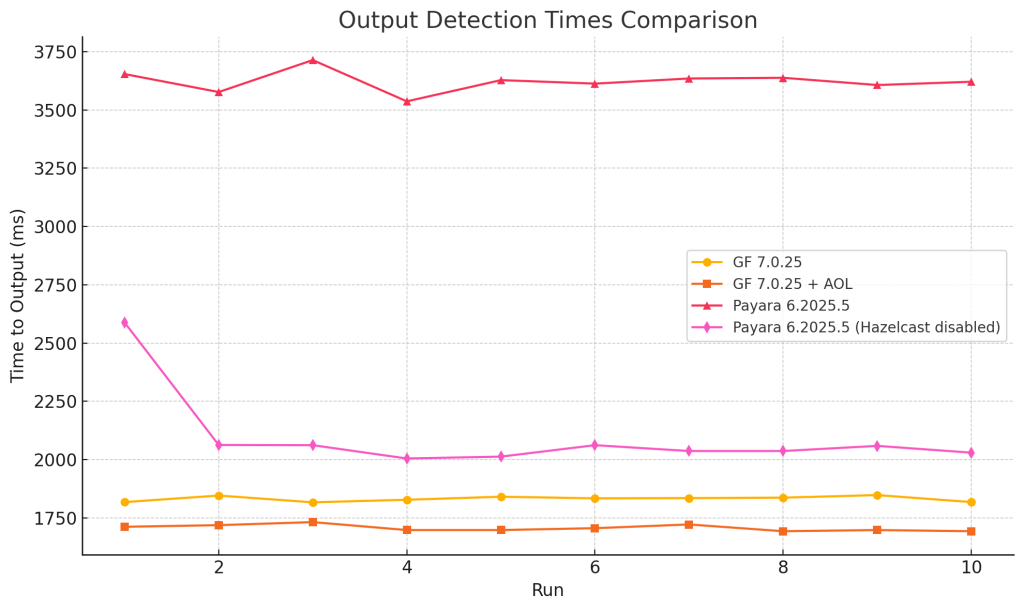
The following shows a graph of all the measured times:
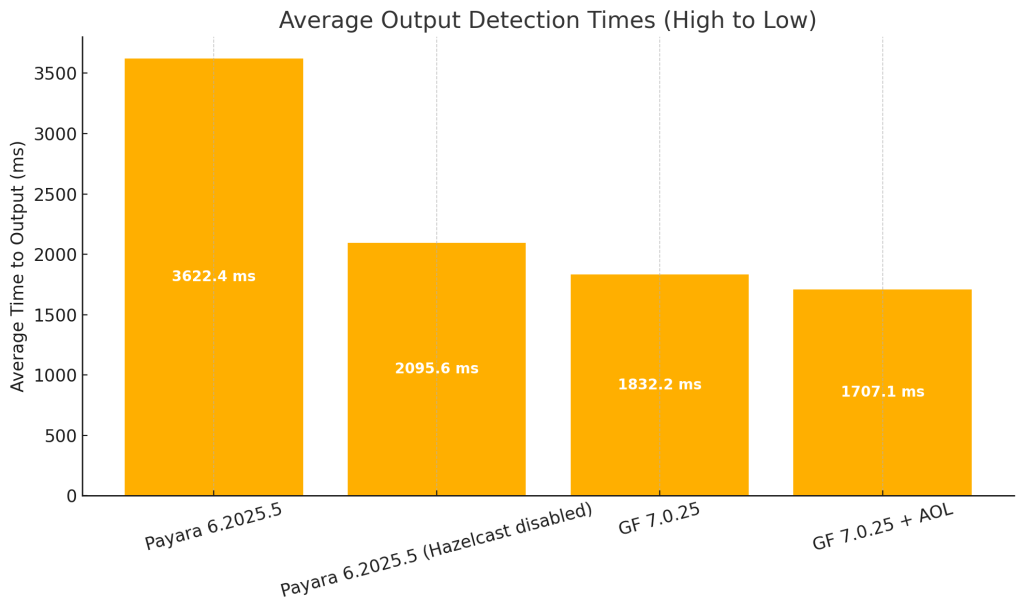
The average time for each server tested is shows next:
As an extra measurement, let’s take a look at GlassFish 8 M12. GlassFish 8 M12 is a milestone version of GlassFish 8 which is still in development, and as such not suited for production.
GF 8 M12
🎯 Output detected after 1803 ms
🎯 Output detected after 1703 ms
🎯 Output detected after 1751 ms
🎯 Output detected after 1672 ms
🎯 Output detected after 1685 ms
🎯 Output detected after 1681 ms
🎯 Output detected after 1665 ms
🎯 Output detected after 1704 ms
🎯 Output detected after 1703 ms
🎯 Output detected after 1665 ms
Out of the box and without an AOT class loading cache, GlassFish 8 in on par with GlassFish 7.0.25 with such cache, and therefor faster than GlassFish 7.0.25 out of the box, which is very promising.
We can conclude that GlassFish starts up relatively fast. GlassFish 8 seems to startup somewhat faster even, but we tested a non-final version. Payara is slow to startup out of the box. Even with Hazelcast disabled, Payara starts slower than GlassFish. There is of course more to just startup performance, and for a follow-up article we’d like to look at the time it takes until the first request is served when using Jakarta Servlet and Jakarta REST. In such setup the usage of the Java 24 AOT class loading cache could maybe have more impact.
